

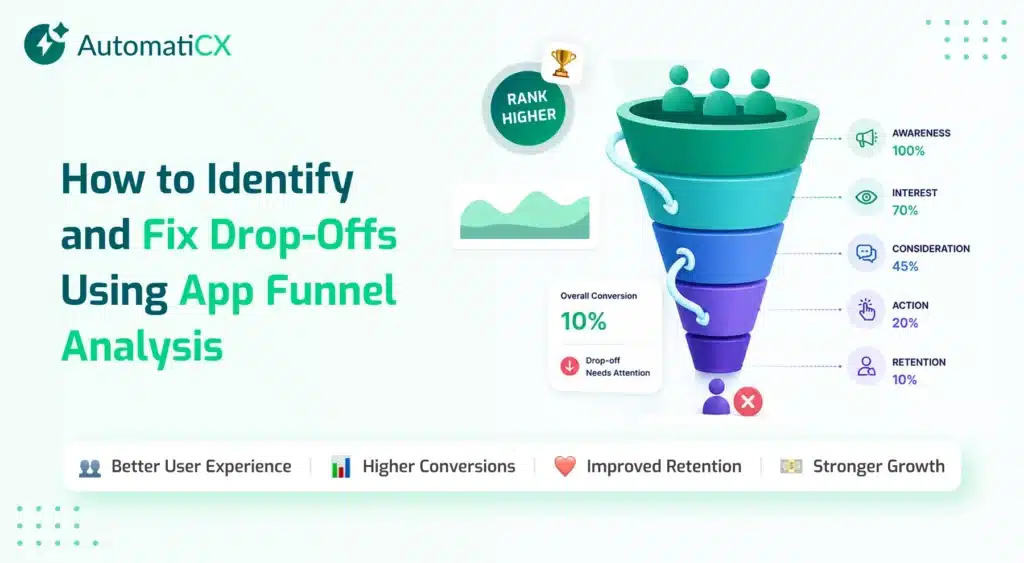
High traffic with low revenue means your user journey is fundamentally broken. You might have executed a flawless marketing campaign, but if the software interface stops the user from purchasing, your acquisition budget is completely wasted.
Funnel analysis acts as a diagnostic framework for this exact problem. It stops product teams from guessing what users hate and provides hard, mathematical evidence of exactly which screen forces them to close the application.
Mobile app funnel analysis is the process of tracking users through a defined, sequential series of events to identify exactly where they abandon your software. By measuring drop-off rates between micro-conversions like moving from a product page to checkout product teams can isolate UI friction, fix broken flows, and drastically improve overall conversion rates.
What is Mobile App Funnel Analysis?
Tracking a user through a defined, sequential series of events reveals how many people survive from the first screen to the final goal.
Many product managers only look at the final goal (the macro-conversion). This is a severe analytical mistake because it ignores the micro-conversions. A micro-conversion is the required intermediate step between two screens, such as adding an item to a digital cart. Tracking these micro-conversions is the only way to understand exactly where the user journey breaks down.
Tracking your drop-offs goes hand in hand with tracking user sentiment. Using an automated Customer Feedback Tool helps you identify if a sudden drop-off is caused by a technical bug reported in your latest reviews.
Mapping the User Journey
To execute this analysis properly, map the user journey linearly. Define the exact actions a user has to take to convert. Consider a standard retail consumer application: the app funnel analysis begins when the user opens the software and ends when they complete a transaction.
Journey Stage | User Action | Diagnostic Value |
Step 1 | App Open | Baseline traffic entering the funnel. |
Step 2 | Search for Product | Shows intent and search UI usability. |
Step 3 | View Product Details | Indicates product interest and page load speed. |
Step 4 | Add to Cart | The critical micro-conversion before purchase. |
Step 5 | Complete Checkout | The final macro-conversion (Revenue). |
Looking at the total conversion rate from Step 1 directly to Step 5 provides almost zero diagnostic value. If you know that only 2% of users finish the journey, you still have no idea how to fix the problem.
However, analyzing the specific drop-off percentage between Step 3 and Step 4 is infinitely more actionable. If 90% of users abandon the application on this specific screen, it tells your engineering team exactly which interface requires an immediate redesign.
The Mathematics of Drop-Offs
Calculate the stage-to-stage conversion rate by dividing the number of users who completed a step by the number of users who completed the previous step.
For example, if 1,000 users complete Step 3 and 200 complete Step 4, your stage conversion rate is exactly 20%.
Understanding this mathematics reveals a powerful growth principle: small percentage increases at the top of the funnel compound into massive revenue gains at the bottom. You do not need to double your total marketing traffic to double your revenue. You simply need to remove the friction from your weakest intermediate step.
Play with the calculator below to see exactly how improving one intermediate micro-conversion drastically impacts your final projected revenue:
Diagnosing the Friction (Why Users Leave)
Once you identify the weakest stage in your funnel, diagnose the specific friction causing the drop-off. Fixing these broken stages directly improves your product stickiness, a concept we cover deeply in our guide to App Retention Metrics.
Here is how to interpret common drop-off points within your data:
High drop-off at login
This usually indicates forced account creation. If you demand a verified email address before demonstrating the core value of the software, a massive percentage of users will leave instantly.
High drop-off at checkout
This points directly to a broken payment gateway or unexpected shipping fees. Users lose trust instantly if the final payment screen is confusing, slow, or demands redundant information.
High drop-off mid-session
This often reveals technical latency or a confusing user interface. If a specific product page takes six seconds to load an image, the user will close the application out of frustration.
Tracking Your Funnels Automatically
Trying to piece together this data using raw event logs or basic spreadsheets is impossible at scale. You cannot manually connect thousands of independent button clicks into a coherent, linear user journey.
To fully understand the difference between tracking an isolated event and tracking a completed funnel, review our core Mobile App Analytics Guide.
You need a centralized system that tracks sequential steps automatically without manual data entry. Leading industry platforms like Mixpanel and Amplitude have set the standard for visual tracking, but as your operations scale, you need a solution built directly into your broader app management workflow.
This is where the AutomatiCX Platform excels. It builds visual funnels instantly based on user behavior, allowing your growth team to see exactly where users abandon the software without writing complex SQL queries. When you automate your funnel tracking, you stop wasting engineering hours on guesswork. You isolate the friction, fix the specific broken screen, and watch your final conversion rates multiply.
Frequently Asked Questions
What is an app funnel analysis in mobile analytics?
Funnel analysis is the process of mapping and tracking a specific series of steps a user must take to complete a goal within an application. It is used to identify the exact screen where the highest percentage of users abandon the process.
How do you improve app funnel conversion rates?
Improve conversion rates by isolating the specific funnel stage with the highest drop-off and removing friction from that specific screen. This often includes removing mandatory account creation, speeding up load times, or simplifying checkout forms.
What is a micro-conversion?
A macro-conversion is the ultimate goal, such as completing a purchase. A micro-conversion is a required intermediate step, such as adding an item to a cart or successfully completing a tutorial level. Tracking micro-conversions allows teams to pinpoint where a user journey breaks.